Graphing Digital Assets
Month in Review — December 2024
As we look ahead to 2025, December’s Graphing Digital Assets revisits some of our favorite data and how the markets moved throughout 2024. Will we see new patterns emerge in the coming year, particularly as the new administration takes office in the U.S.?
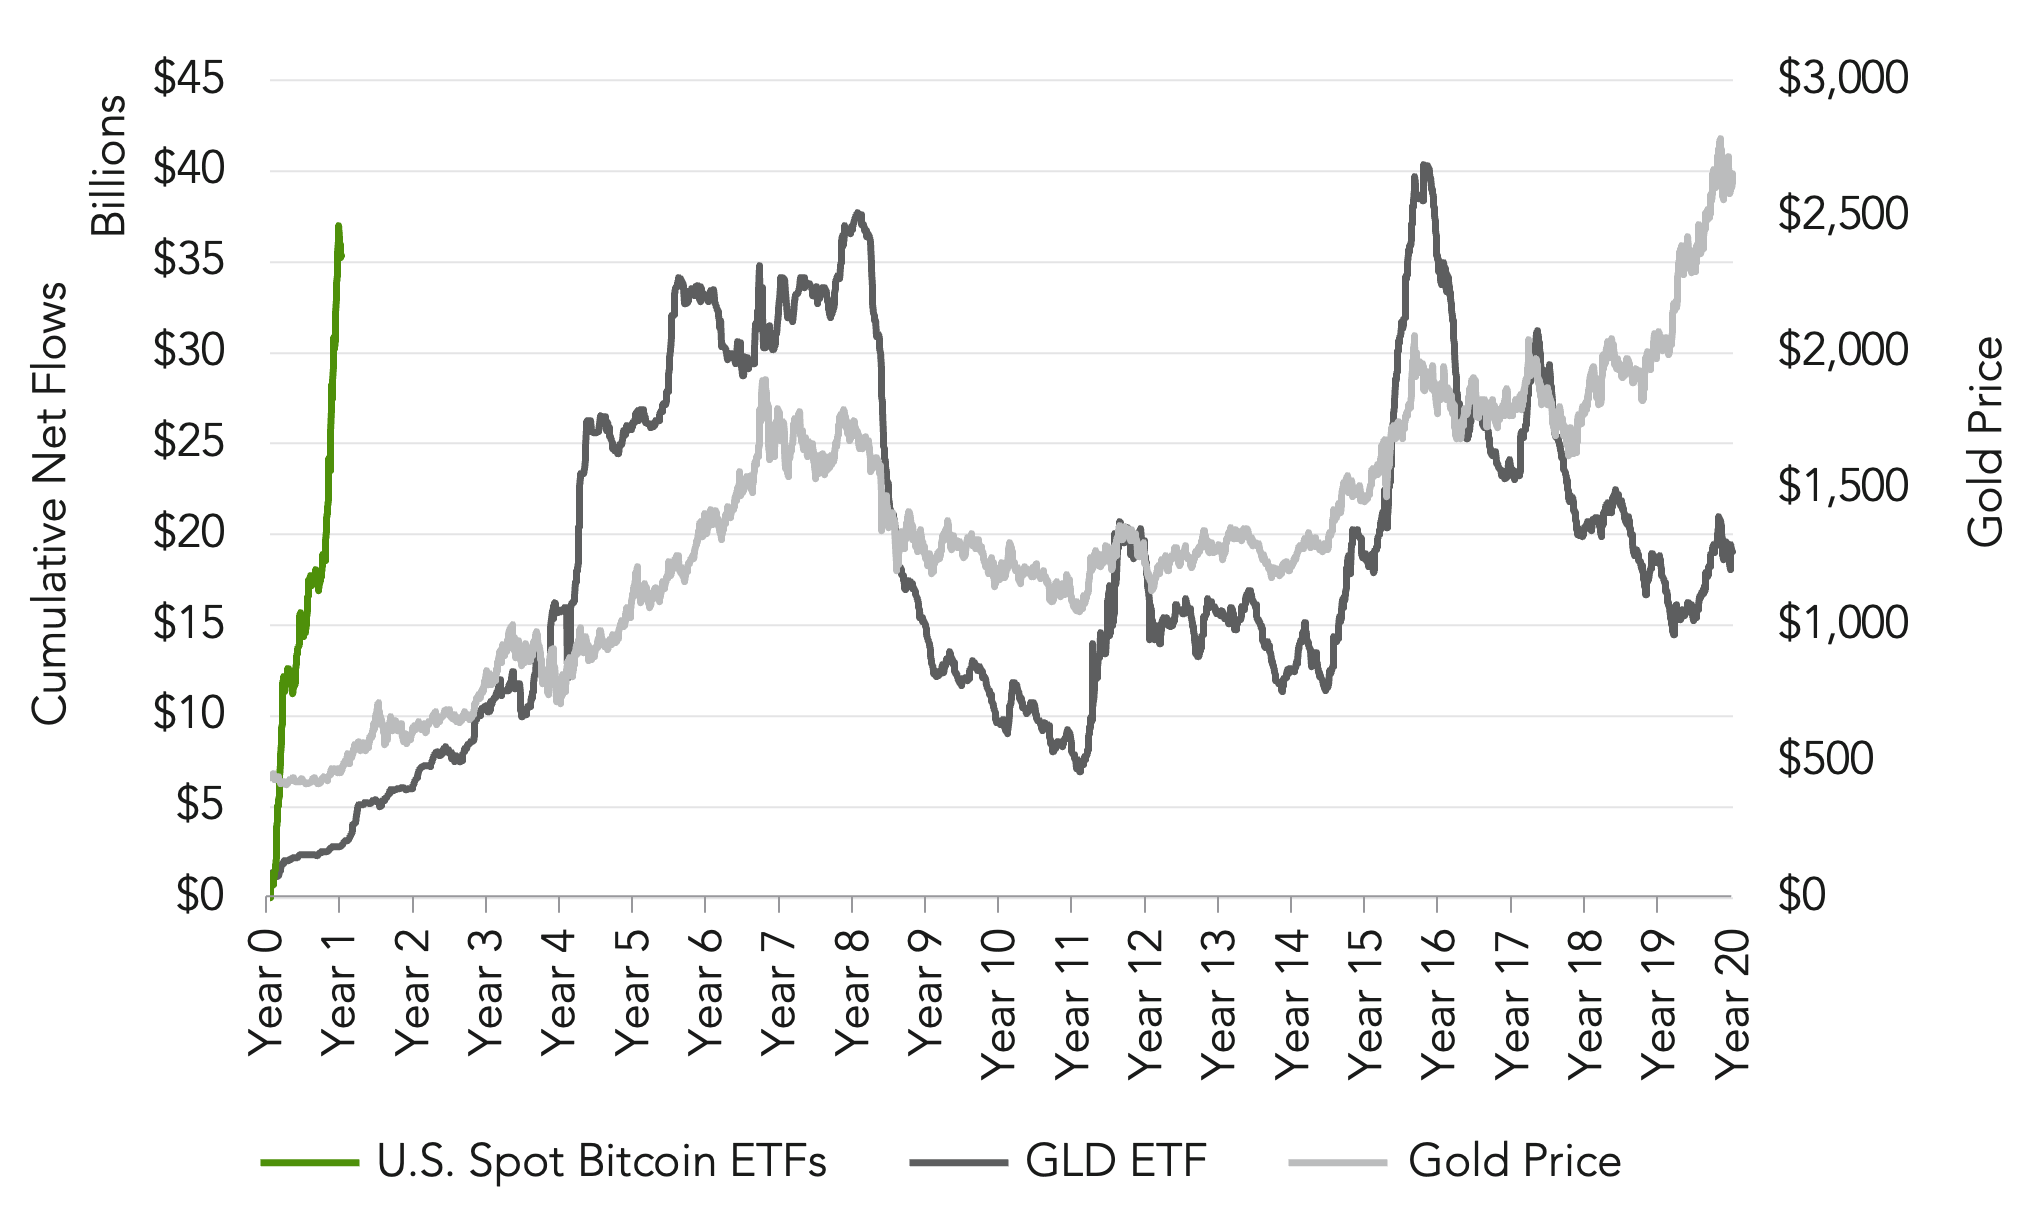
Historical GLD and BTC ETF Cumulative Net Flows & Gold Price
2024 opened with the launch of spot bitcoin ETFs in the U.S. In January, we compared bitcoin to gold and the launch of gold ETFs in the U.S. in order to explore the potential effect the ETFs would have on growth of bitcoin. U.S. spot BTC ETFs flows reached year-eight GLD ETF flow levels within their first year. Over the years, gold price moved in conjunction with gold ETF flows; we similarly witnessed the exponential growth of bitcoin price (+120.76% in 2024) in conjunction with increased bitcoin ETF flows.
Source: Farside Investors; ETF.com; TradingView (XAU/USD). As of December 31, 2024.
2024 U.S. Spot Bitcoin ETFs Net Flows & BTC Price
We continued to monitor U.S. spot bitcoin ETF flows throughout the year, highlighting a rise in outflows following macroeconomic events in August. Flows ended the year on a positive note, led by BlackRock’s IBIT, as the price of bitcoin reached new all-time highs.
Source: Farside Investors and Yahoo Finance, January 10, 2024, through December 31, 2024.
DeFi Total Value Locked (TVL)
In June, we reported a resurgence in DeFi opportunities despite a slowdown in the overall cryptocurrency market. The DeFi landscape and its inherent investment opportunities have continued to grow, with TVL trending towards the historical highs seen 2021.
Source: DefiLlama. Data as of December 31, 2024.
Tokenized Value of U.S. Government Securities by Product
Tokenization of real-world assets was a trending topic in May, with increasing institutional interest driving the adoption of tokenized U.S. Treasuries. By year-end, these products saw substantial inflows, propelled by BlackRock’s tokenized treasury fund, BUIDL, the first first of its kind to cross $500 million in market value.
Source: https://dune.com/21co/tokenization-government-securities.
VIX Seasonality
Amidst the August unwind, we compared a surge in volatility against the historical seasonal patterns in volatility and market sentiment in prior years. Not surprisingly, macroeconomic factors have a significant effect on the Cboe Volatility Index and trading, as evident in the most recent December spike in reaction to the Fed’s hawkish messaging following the last FOMC meeting.
Source: VIX daily close data from Yahoo Finance.
U.S. Inflation Rates vs. Interest Rates
As we move into 2025 and the Fed’s presumed hawkish stance on monetary policy, we conclude our look back on 2024 with an overview of inflation rates and how FOMC rate changes have affected inflation throughout the year. What will this mean for 2025?
Source for inflation rate: https://www.usinflationcalculator.com/inflation/current-inflation-rates/ as of January 15, 2025. 2024 monthly data: annual inflation rate for the United States for the 12 months ending at each month, according to U.S. Labor Department data. Source for fund rate: https://fred.stlouisfed.org/series/fedfunds.


